Research objective
Determine which cell types carry the strongest SCZ genetic enrichment signal, which regulatory and pathway-level programs survive independent verification across multiple computational frameworks, and whether those programs converge on a coherent biological architecture or mainly reveal the limits of current post-GWAS inference.
The approach:
- Fisher’s exact gene-set overlap (PanglaoDB cell-type markers × Pardiñas 2018 prioritized genes), with cross-dataset replication, brain-expressed background restriction, and gene-length-matched permutation
- Stratified LD-score regression (S-LDSC, baseline-LD v2.2) on PGC3 European-ancestry summary statistics for cell-type heritability partitioning, sex-stratified analysis, cross-ancestry extension (East Asian PGC3), and disease-specificity controls (IBD, height)
- Regulon-based enrichment (DoRothEA) with independent verification by JASPAR 2022 position-weight-matrix motif scanning, ENCODE ChIP-seq peak overlap, and cross-disorder motif comparators (ASD, DDD, constrained brain-expressed genes)
- Evolutionary constraint analysis (gnomAD v4.1 pLI, LOEUF, missense Z; cross-version concordance with v2.1.1: pLI ρ=0.833) across SCHEMA exome-wide significant genes, hand-curated synaptic subsets, and functional tier decomposition with SynGO class-effect decomposition
- Cross-disorder replication (ASD, dominant developmental disorders, bipolar, MDD, ADHD, AD, IBD, height) and developmental-stage profiling (BrainSpan)
- Polygenic Priority Score (PoPS) gene-level ranking with feature-category ablation and circularity audit
- Drug-target overlap tested across four backgrounds (DGIdb strict: all protein-coding, brain-expressed, druggable-universe, expression+length matched)
All analyses use publicly available GWAS summary statistics and annotation resources. No original experimental data were generated.
This is a living project. Marvin has finished this iteration using existing public data and literature. The next iteration begins when you contribute: a critique of the analysis, an alternative interpretation, a dataset we missed, a question we haven’t asked, or experimental validation of a finding. Marvin will incorporate your input and run the next research cycle, published openly, for free. See open questions below or learn more about how IORI works.
Summary of discoveries
-
Neurons are the primary enriched cell type — Strong. Six orthogonal lines of evidence converge: Fisher overlap OR=9.76 (FDR=1.79×10⁻¹⁰), cross-dataset replication OR=29.88, brain-expressed background OR=7.87, gene-length-matched permutation adjusted OR=6.94, S-LDSC neuronal annotation 1.83-fold enrichment (p=0.009), sex-stratified S-LDSC directionally concordant (Cohen’s h=0.006, negligible sex difference). The strongest and most reproducible cell-type result.
-
Microglia are NOT enriched — Strong. OR=1.11 (p=0.53). Zero overlap between PGC3 prioritized genes and PanglaoDB microglia markers. Immune-associated findings (complement, TLR pathway) persist within neuronal risk sets, not as cell-autonomous microglial burden.
-
NF-κB pathway enrichment is a circular false positive — Strong. Traced to the DoRothEA input gene list: 14 of 88 “confirmed SCZ” genes were immune-cluster members pre-selected from prior complement, cytokine, NF-κB, and TLR analyses. 86% of RELA regulon overlaps attributable to those 14 pre-selected genes. Methodological contribution: DoRothEA-style regulon enrichment is sensitive to disease-specific gene-set curation and should be verified with annotation-independent methods.
-
EGR1, MEF2C, and CTCF are enriched at SCZ gene promoters — with cross-disorder context — Strong for enrichment; Moderate for SCZ-specificity. All three recur across DoRothEA regulon overlap AND independent JASPAR PWM motif enrichment (EGR1 OR=4.98; CTCF OR=3.15; MEF2C OR=3.84). Cross-disorder comparators show that EGR1 and MEF2C motif enrichment is shared across neurodevelopmental disorders (EGR1: DDD OR=13.89, ASD OR=11.90, both exceeding SCZ OR=4.98; MEF2C: ASD OR=8.72, DDD OR=5.42). CTCF is the only tested factor showing possibly SCZ-preferential enrichment (all comparators non-significant; bootstrap-confirmed, 100 draws). EGR1 and MEF2C are best understood as regulatory factors for the constrained neurodevelopmental gene class, with SCZ genes enriched as members of that class.
-
Evolutionary constraint concentrates at synaptic loci via a two-layer architecture — Strong. The most important architectural finding. The full common-variant risk set (EDT1, n=261) shows no significant constraint (pLI OR=1.14, p=0.41). The 14-gene hand-curated synaptic list (B3) shows extreme constraint (pLI OR=26.44, p=2.22×10⁻⁷). Critically, this decomposes into two stacking effects: synaptic genes as a class are broadly constrained (non-SCZ SynGO genes pLI OR=4.45, 44.2% in the most-constrained bin vs 15.1% genome-wide), and within that class, SCZ-associated synaptic genes show additional concentration (within-class OR=6.94, p=0.004, 84.6% vs 44.2%). SCZ risk preferentially targets the most dosage-sensitive members of the most constrained functional class. SCHEMA rare-variant genes (n=9) are categorically constrained (all pLI>0.9). Functional decomposition: synaptic scaffold (pLI OR=20.91), glutamate receptors (Haldane-corrected OR=32.5, 3/3 genes pLI>0.9), transcriptional regulators (pLI OR=13.91). Ion channel and mitochondrial genes show no constraint.
-
Cross-disorder constraint is shared, not SCZ-exclusive — Moderate. ASD risk genes (OR=25.4) and dominant developmental disorder genes (OR=31.3) show constraint enrichments of the same magnitude as SCZ, with no Holm-significant pairwise differences. The constraint axis is shared across severe neurodevelopmental conditions. SCZ-distinctive features reside at the within-class constraint concentration (OR=6.94), possibly at CTCF motif enrichment, and at the cortical cell-type S-LDSC level where only SCZ reaches significance among tested disorders.
-
Drug-target overlap is definition-dependent; regulatory targeting may be more tractable — Moderate. Drug-target overlap depends on the background: SCZ genes are enriched relative to the genome (DGIdb OR=2.33, p=3×10⁻⁹) but show no enrichment relative to the druggable universe (OR=1.03, p=0.93). The constrained synaptic proteins are biologically difficult to perturb directly. The regulatory layer — EGR1-mediated activity-dependent transcription (shared across NDD conditions) and CTCF-mediated chromatin architecture (possibly SCZ-preferential) — may represent the more tractable therapeutic axis.
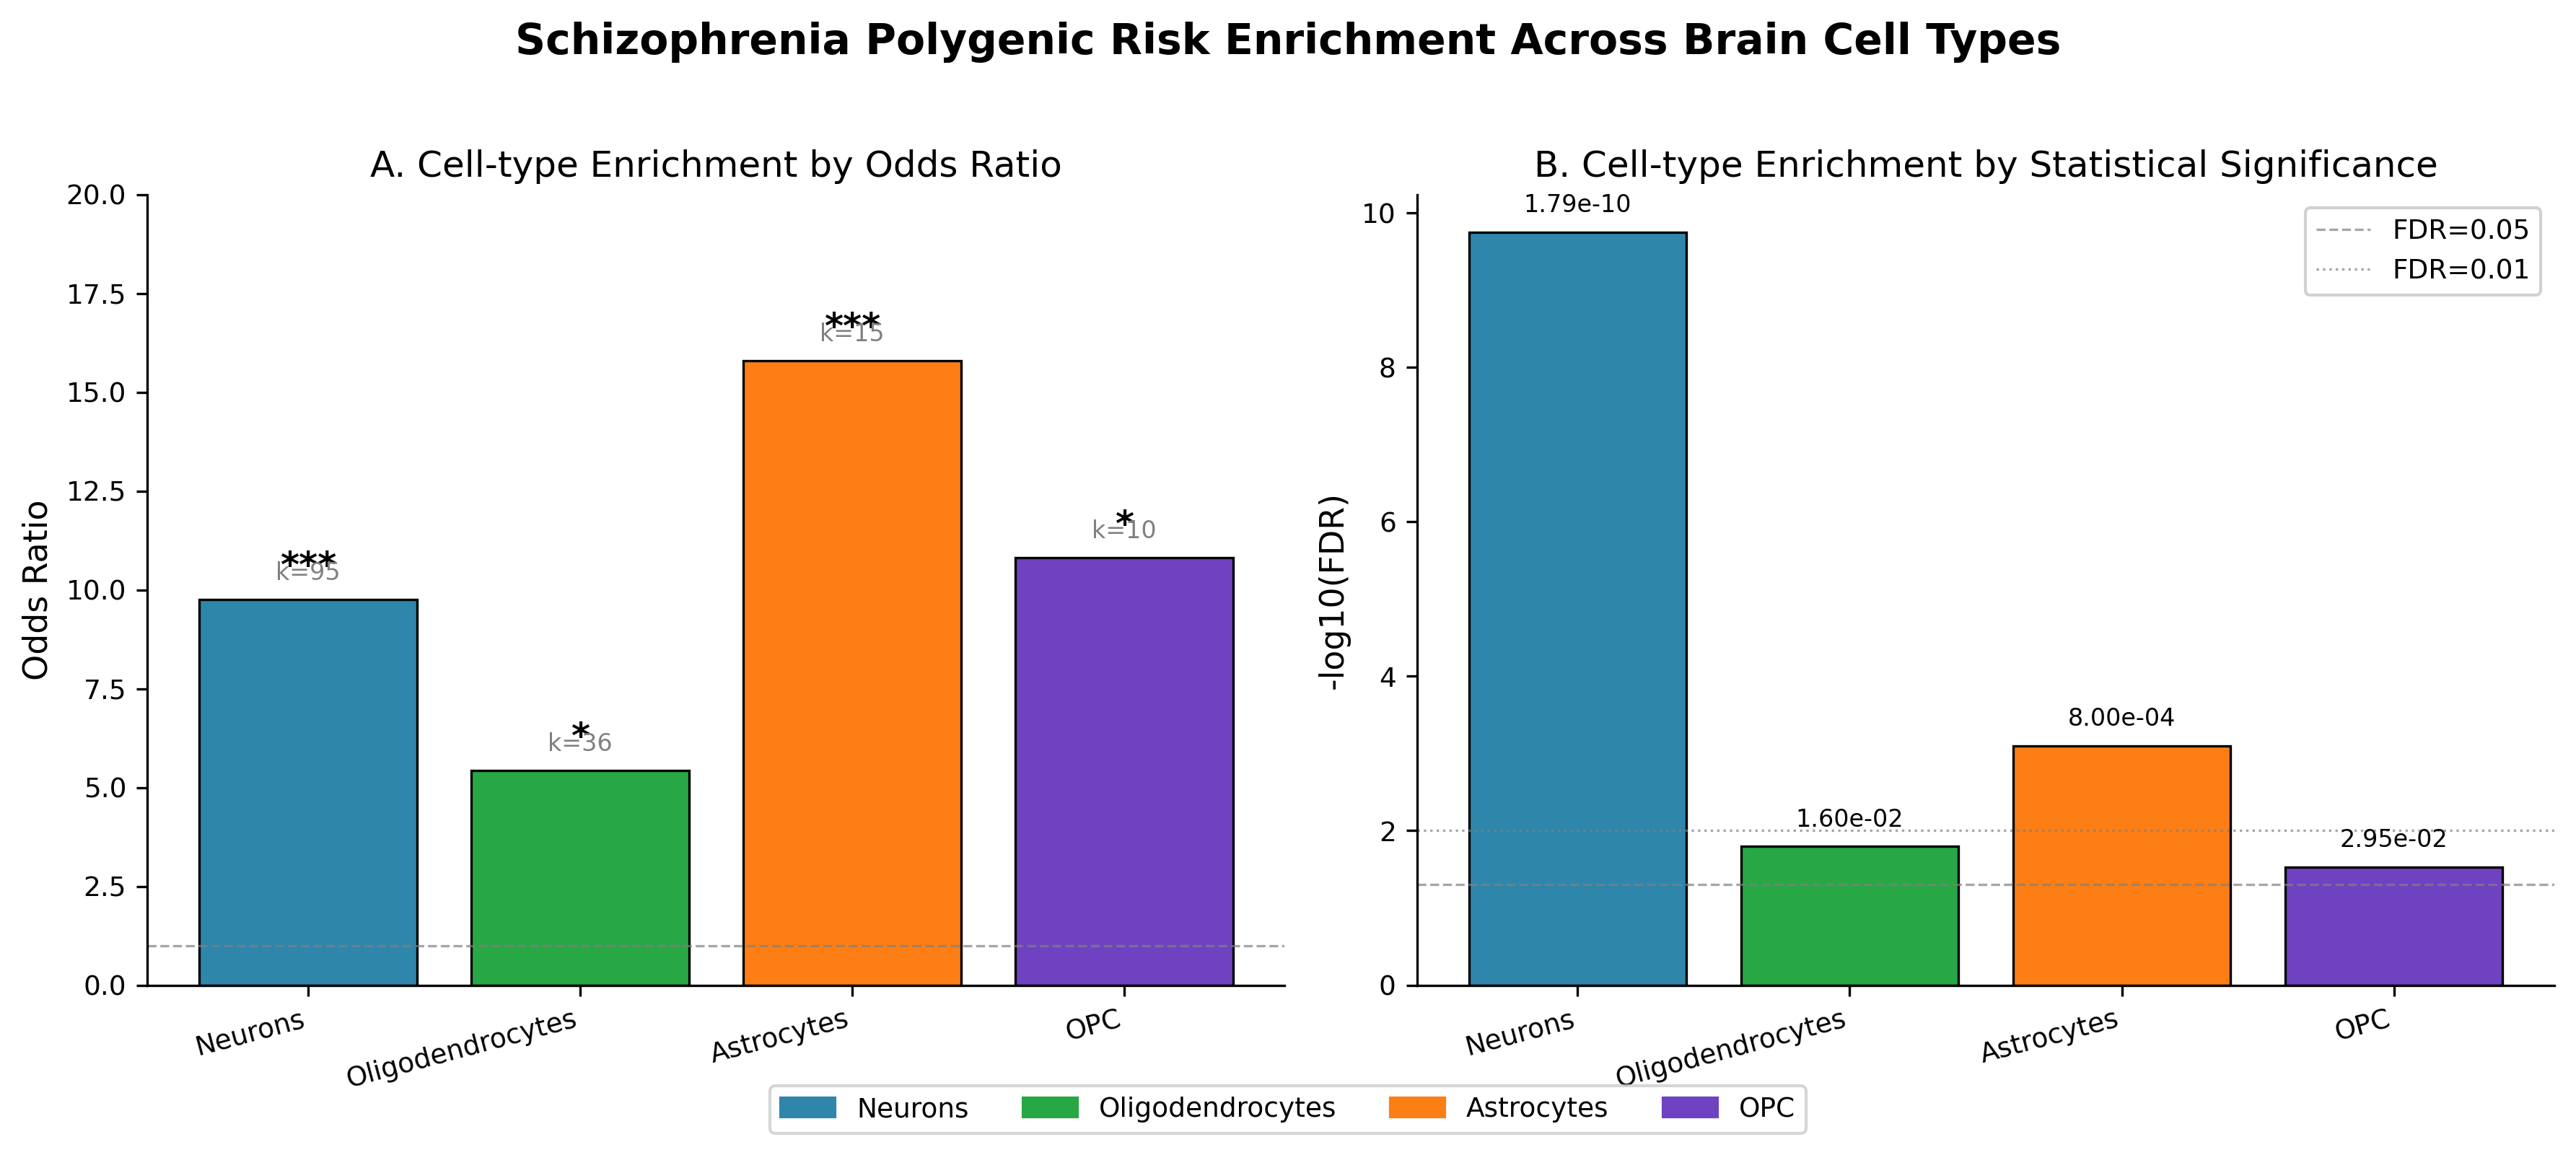 Cell-type enrichment for SCZ common-variant risk genes. Neuronal markers show strong enrichment (OR=9.76, FDR=1.79×10⁻¹⁰); microglia show no enrichment (OR=1.11, p=0.53). Oligodendrocytes show a weaker signal (OR=5.43, FDR=0.016).
Open questions for the community
This project is entirely computational. Every finding rests on summary statistics, curated gene sets, and annotation databases. The next steps are experimental, and the computational reanalysis has been done exhaustively. We are looking for:
- East Asian ancestry S-LDSC with larger sample size. The EAS neuronal coefficient is near zero with adequate precision (coefficient-driven, not power-limited). Larger EAS GWAS are needed to determine whether this reflects a genuine cross-ancestry difference or a threshold effect.
- Single-cell perturbation of EGR1 and CTCF in human iPSC-derived cortical neurons. EGR1 motif enrichment predicts that EGR1 knockdown should reduce expression of constrained synaptic genes — but this prediction applies across SCZ, ASD, and DDD gene sets, not only SCZ. CTCF perturbation should alter chromatin topology at constrained synaptic loci and may have a more SCZ-preferential effect. Neither prediction has been tested.
- Cell-type-resolved cortical eQTL data. The project identifies regulatory convergence at the motif level but cannot test whether this translates to cell-type-specific expression effects. Single-cell eQTL in human cortical neurons would close this gap.
- Postsynaptic-density proteomics from SCZ patient-derived iPSC neurons. The constraint architecture predicts protein-level changes at the PSD, not just mRNA changes. Matched proteomics and transcriptomics in disease-relevant cells would test this directly.
- Activity-dependent EGR1 binding maps in live cortical neurons. The ChIP-seq null (EGR1 OR=1.58, p=0.37 in post-mortem hippocampus/cortex) is interpretable as an activity-dependent false negative: EGR1 binding is stimulus-induced and unlikely to be captured in post-mortem tissue. Stimulus-evoked ChIP-seq or CUT&Tag in live neurons would resolve whether EGR1 occupancy at SCZ risk loci is activity-gated.
- A tested-but-not-significant comparator set for cross-disorder constraint. The cross-disorder equivalence rests on absence of significant pairwise differences, but absence of evidence is not evidence of absence. A tested-but-not-significant rare-variant gene set (genes with adequate exome power but no significant SCZ association) would strengthen the specificity claim. This confound is testable and is a priority for future work.
- Is CTCF SCZ-specificity real or will it dissolve with larger ASD gene sets? The ASD comparison for CTCF is underpowered (k=3 overlap genes). Future ASD GWAS with larger gene sets will narrow or confirm this gap.
If you have data, cell systems, or relevant expertise, file an issue on the project repository or email [email protected].
Findings
Neuronal enrichment
Fisher’s exact test against PanglaoDB cell-type markers showed strong neuronal enrichment (OR=9.76, FDR=1.79×10⁻¹⁰). Oligodendrocytes showed a weaker signal (OR=5.43, FDR=0.016). Cross-dataset replication with an independent neuronal marker panel retained the signal (OR=29.88, 95% CI [12.15, 73.48], p=5.52×10⁻⁹). Restricting the background to brain-expressed genes did not abolish the effect (OR=7.87, p=9.9×10⁻¹⁰), arguing against a trivial “brain genes versus non-brain genes” explanation.
S-LDSC provided orthogonal SNP-heritability-level support. Using the baseline-LD v2.2 model for conditional analysis, neuronal annotations showed 1.83-fold enrichment (p=0.009), while oligodendrocyte, astrocyte, and OPC annotations were not significant. A joint model including all four cell types simultaneously returned an identical neuronal coefficient (τ*=0.83, enrichment=1.83-fold), confirming the signal is not driven by co-expression with other cell types. Partitioning against the 97 baselineLD functional categories also retained neuronal enrichment, so the result is not an artifact of generic functional-element enrichment.
Gene-length-matched permutation attenuated the raw Fisher estimate from OR=9.96 to an adjusted OR of 6.94, with no permutation exceeding the observed overlap in 10,000 draws (empirical p<10⁻⁴). Sex-stratified S-LDSC showed directional concordance: males 1.78-fold (p=0.010), females 1.70-fold (p=0.239), with Cohen’s h between heritability proportions of 0.006, consistent with a power-asymmetry interpretation rather than meaningful sex divergence.
A random-effects meta-analysis across three SCZ GWAS produced a DerSimonian-Laird summary OR of 4.73 (p=0.011), but the Hartung-Knapp sensitivity analysis gave p=0.154 with substantial heterogeneity (I²=63.9%). The meta-analysis is therefore supportive but not decisive; the core neuronal claim does not depend on it.
Confidence: Strong. Six orthogonal lines of evidence converge. Specification-curve forensic QC confirmed robustness across 5 background denominators and 5 length-kernel variants.
Microglia negative
Microglia did not carry a cell-autonomous SCZ signal. The primary PanglaoDB microglia marker analysis was negative (OR=1.11, p=0.53), and the prioritized PGC3 gene set showed zero overlap with microglia markers. This negative result narrows the interpretation of immune-associated findings: the data do not support a model in which microglia are the principal genetically enriched cell type for common SCZ risk.
The surviving immune-adjacent signal localized to neuronal risk sets. Complement-linked genes (C4A, C4B) and the KEGG TLR pathway remained directionally enriched (OR=5.91, raw p=0.016), but the adjusted FDR was 0.147, above the prespecified threshold. The three overlapping TLR genes were AKT3, IRF3, and MAPK3, pleiotropic kinases (AKT3 in PI3K/AKT, MAPK3 in ERK) alongside one interferon-response factor. The correct conclusion is not that TLR is established, but that it is the strongest surviving pathway-level immune signal after strict correction.
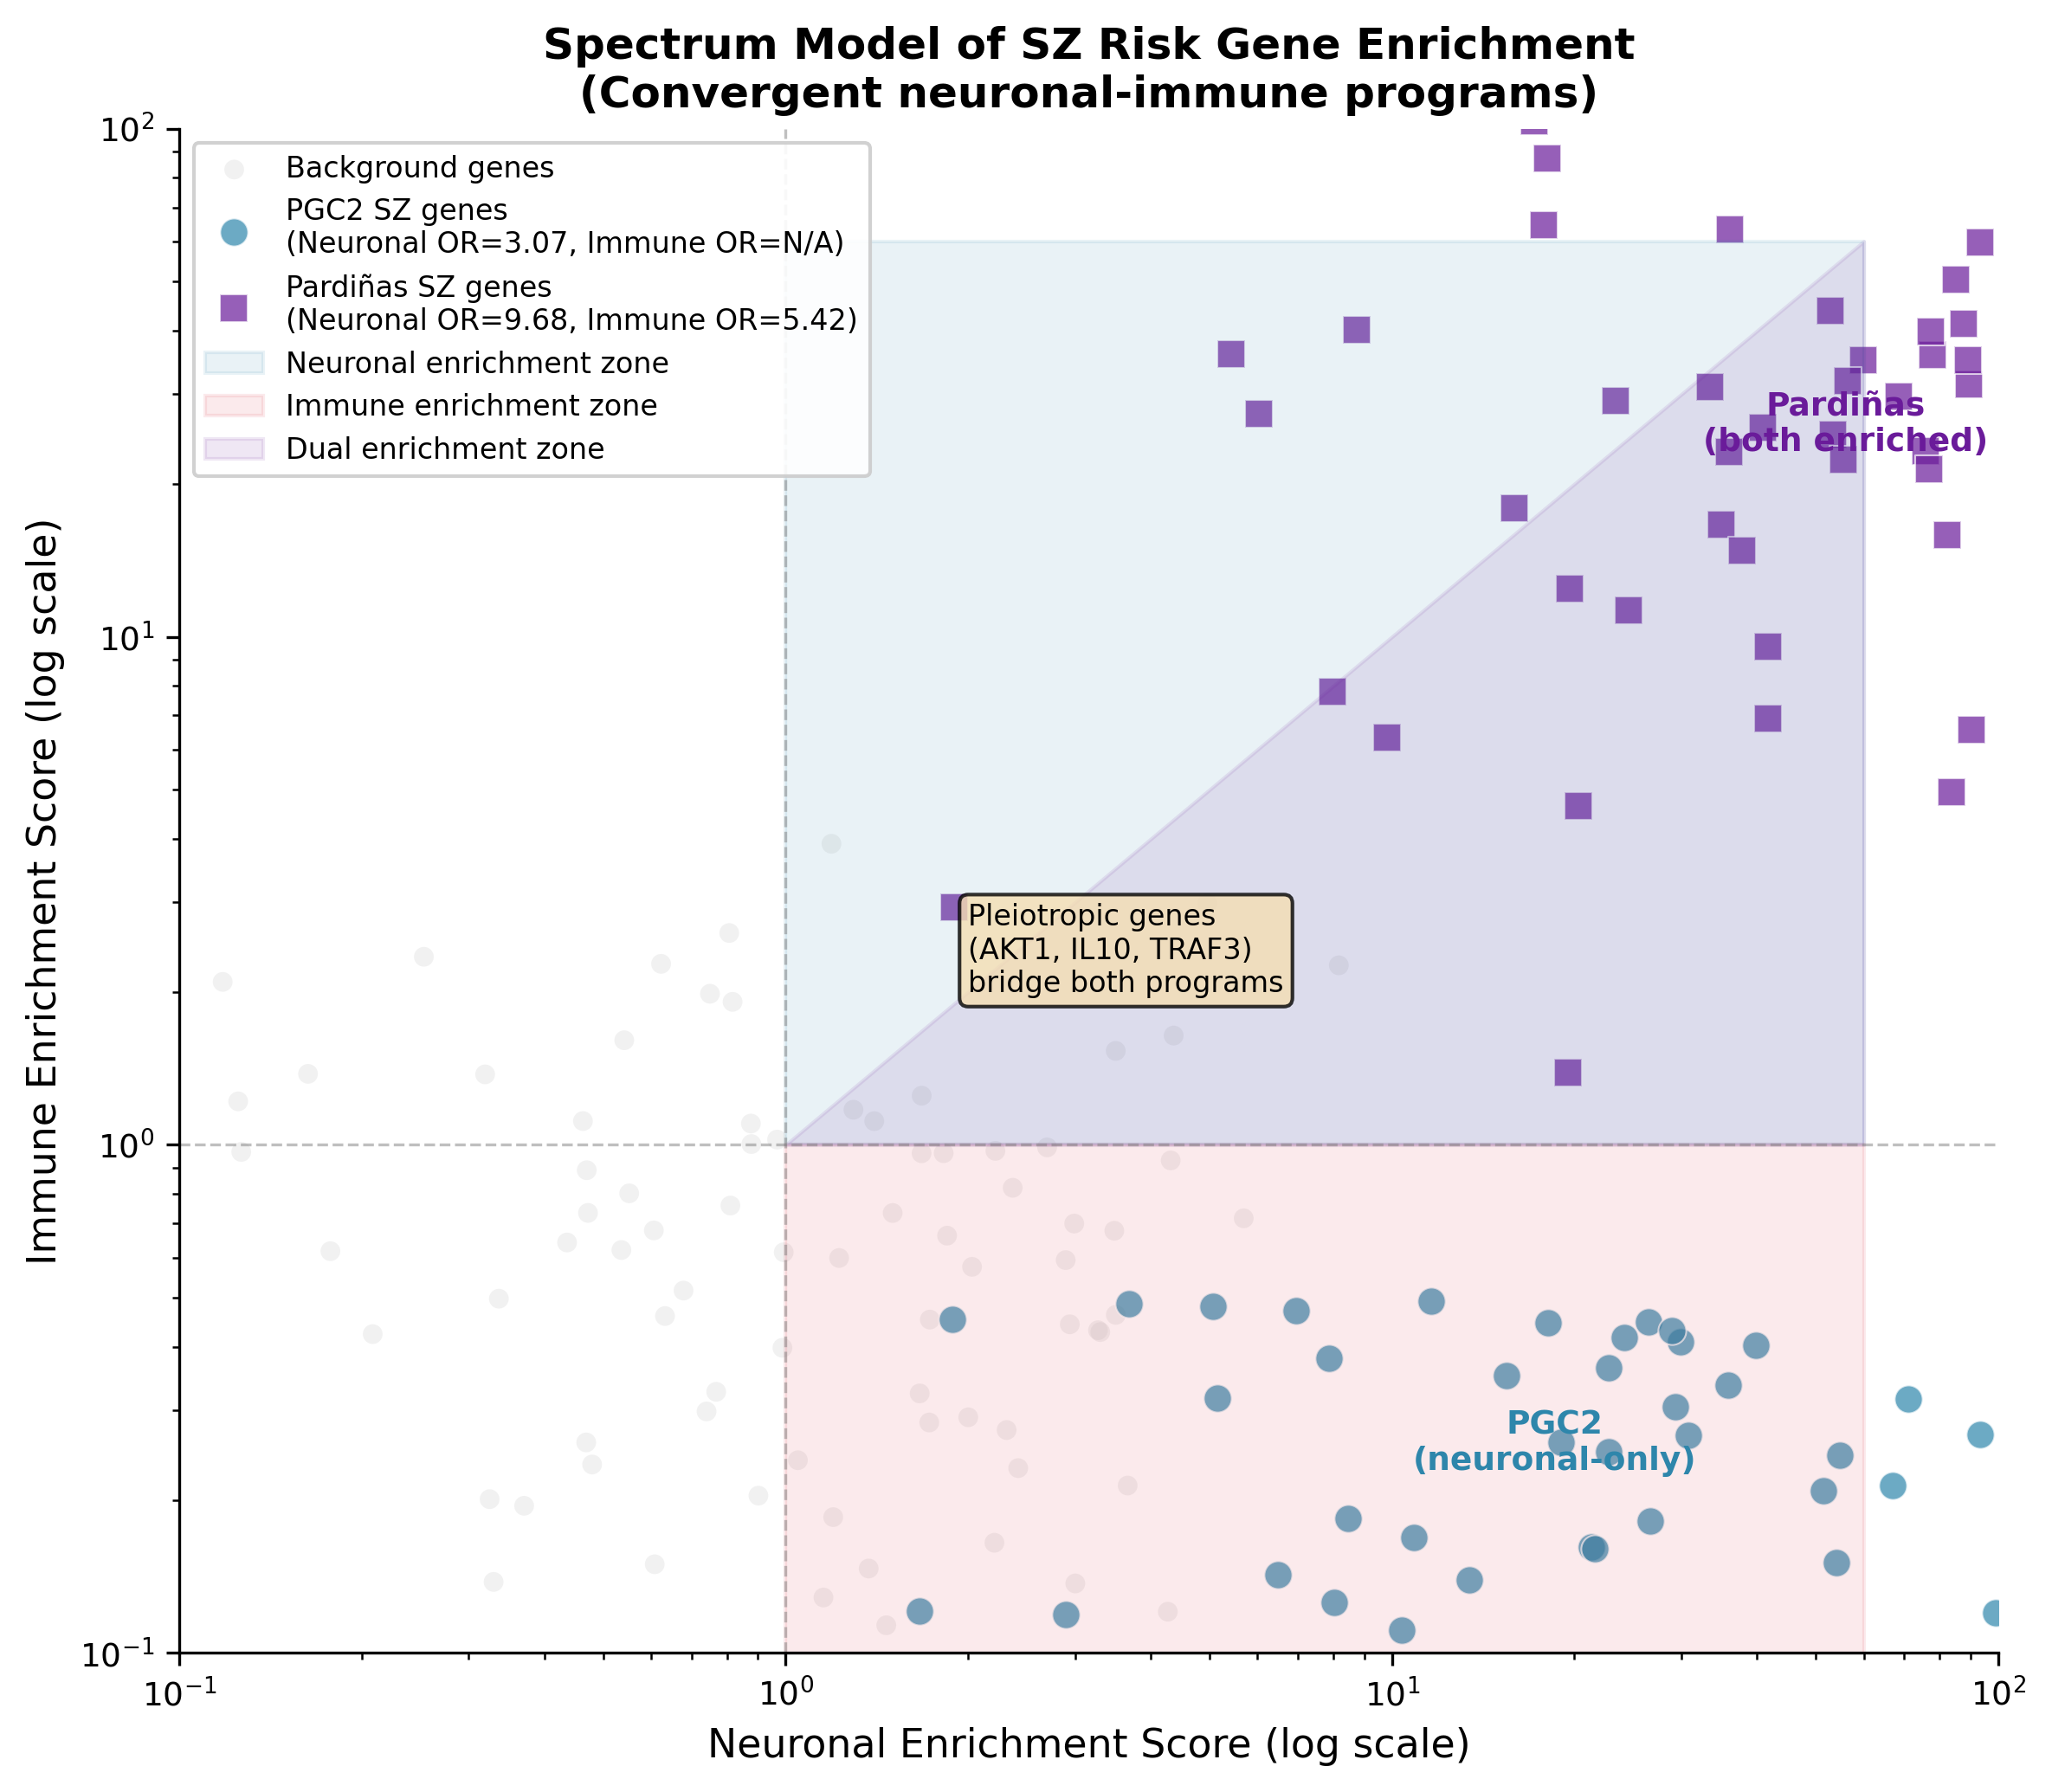 Exploratory neuronal-immune spectrum model. PCA on gene annotation co-occurrence structure shows a neuronal-to-immune gradient (PC1=38.5%, silhouette=0.929), with Pardiñas genes occupying the dual-enrichment region more often than PGC2 genes. Independent differential-expression validation against PsychENCODE (Gandal 2018) was not significant (ρ=0.152, p=0.18). This analysis is descriptive: the axis reflects annotation co-occurrence structure, not a validated biological continuum.
Confidence: Strong as a negative result. TLR pathway signal classified as Moderate (raw p=0.016, FDR=0.147).
NF-κB false positive
Earlier analyses had treated NF-κB as a dominant convergence pathway. Against the prioritized PGC3 list, the RELA regulon showed OR=0.79 (p=0.72) and NFKB1 showed OR=0.76 (p=0.73). Against the broader PGC3 extended list, both remained null to depleted. Tracing the earlier positive result back to its inputs revealed the mechanism: the 88-gene “confirmed SCZ” working set used in the initial DoRothEA analysis had been assembled in part by union with prior immune-pathway findings, so that 14 of its 88 genes were immune-cluster members pre-selected from complement, cytokine, NF-κB, and TLR analyses. Approximately 86% of the RELA regulon overlaps in that original analysis were attributable to those 14 pre-selected genes.
Testing NF-κB enrichment against a gene list that already encoded NF-κB biology is circular by construction. This generalizes beyond the present paper: DoRothEA-style regulon enrichment is sensitive to disease-specific gene-set curation, and pathway-level claims based on such enrichment should be verified with a gene list that does not re-use pathway annotations during its construction.
Confidence: Strong as a documented false positive. Methodological contribution with implications for any project using regulon-based enrichment on curated disease gene sets.
EGR1 and CTCF
The most stable regulatory finding is the cross-framework recurrence of EGR1 and CTCF. In DoRothEA-based regulon overlap, EGR1 was enriched in both neuronal and immune compartments, as was CTCF. Orthogonal PWM motif scanning against JASPAR 2022 retained both factors with corrected significance: EGR1 OR=4.98 (corrected p=4.5×10⁻⁶), CTCF OR=3.15 (corrected p=6.9×10⁻⁵). Three additional TFs also passed motif correction: MEF2C (OR=3.84), TCF4 (OR=2.63), and NFKB1 (OR=2.67, but does not rescue the pathway-level NF-κB claim since RELA/NFKB1 regulon replications against PGC3 remained null).
Cross-disorder motif comparators reveal that EGR1 and MEF2C enrichment is shared across neurodevelopmental conditions. Testing the same PWM pipeline against ASD risk genes (Satterstrom 2020, n=78) and dominant developmental-disorder genes (Kaplanis 2020, n=283): EGR1 enrichment was stronger in DDD (OR=13.89, p=1.4×10⁻²⁰) and ASD (OR=11.90, p=4.5×10⁻⁶) than in SCZ (OR=4.98). MEF2C followed the same pattern (ASD OR=8.72, DDD OR=5.42). EGR1 and MEF2C are therefore regulatory factors for the constrained neurodevelopmental gene class broadly, with SCZ genes enriched as members of that class.
CTCF tells a different story. SCZ CTCF enrichment (OR=3.15, corrected p=6.9×10⁻⁵) was the only tested TF where all three comparators failed to reach significance (DDD OR=1.79, ASD OR=2.46, constrained-brain OR=1.47, all NS). A 100-draw bootstrap of the constrained-brain comparator confirmed the single-draw result is representative (seed=42 at the 41st percentile; bootstrap mean OR=1.81). SCZ CTCF OR=3.15 exceeds the bootstrap 97.5th percentile. The ASD comparison is underpowered (k=3 overlap genes) and future ASD gene lists may close or confirm this gap.
A third framework, direct ENCODE ChIP-seq peak overlap at SCZ gene promoters (±10kb), did not reach significance for either factor (EGR1 OR=1.58, p=0.37; CTCF OR≈0.9, p>0.7). This null is interpretable: EGR1 is an activity-dependent immediate-early gene whose binding is induced by neuronal activity, and adult post-mortem ChIP-seq is unlikely to capture activity-dependent occupancy. CTCF binds the genome near-ubiquitously, inflating the background rate and making promoter enrichment tests inherently underpowered.
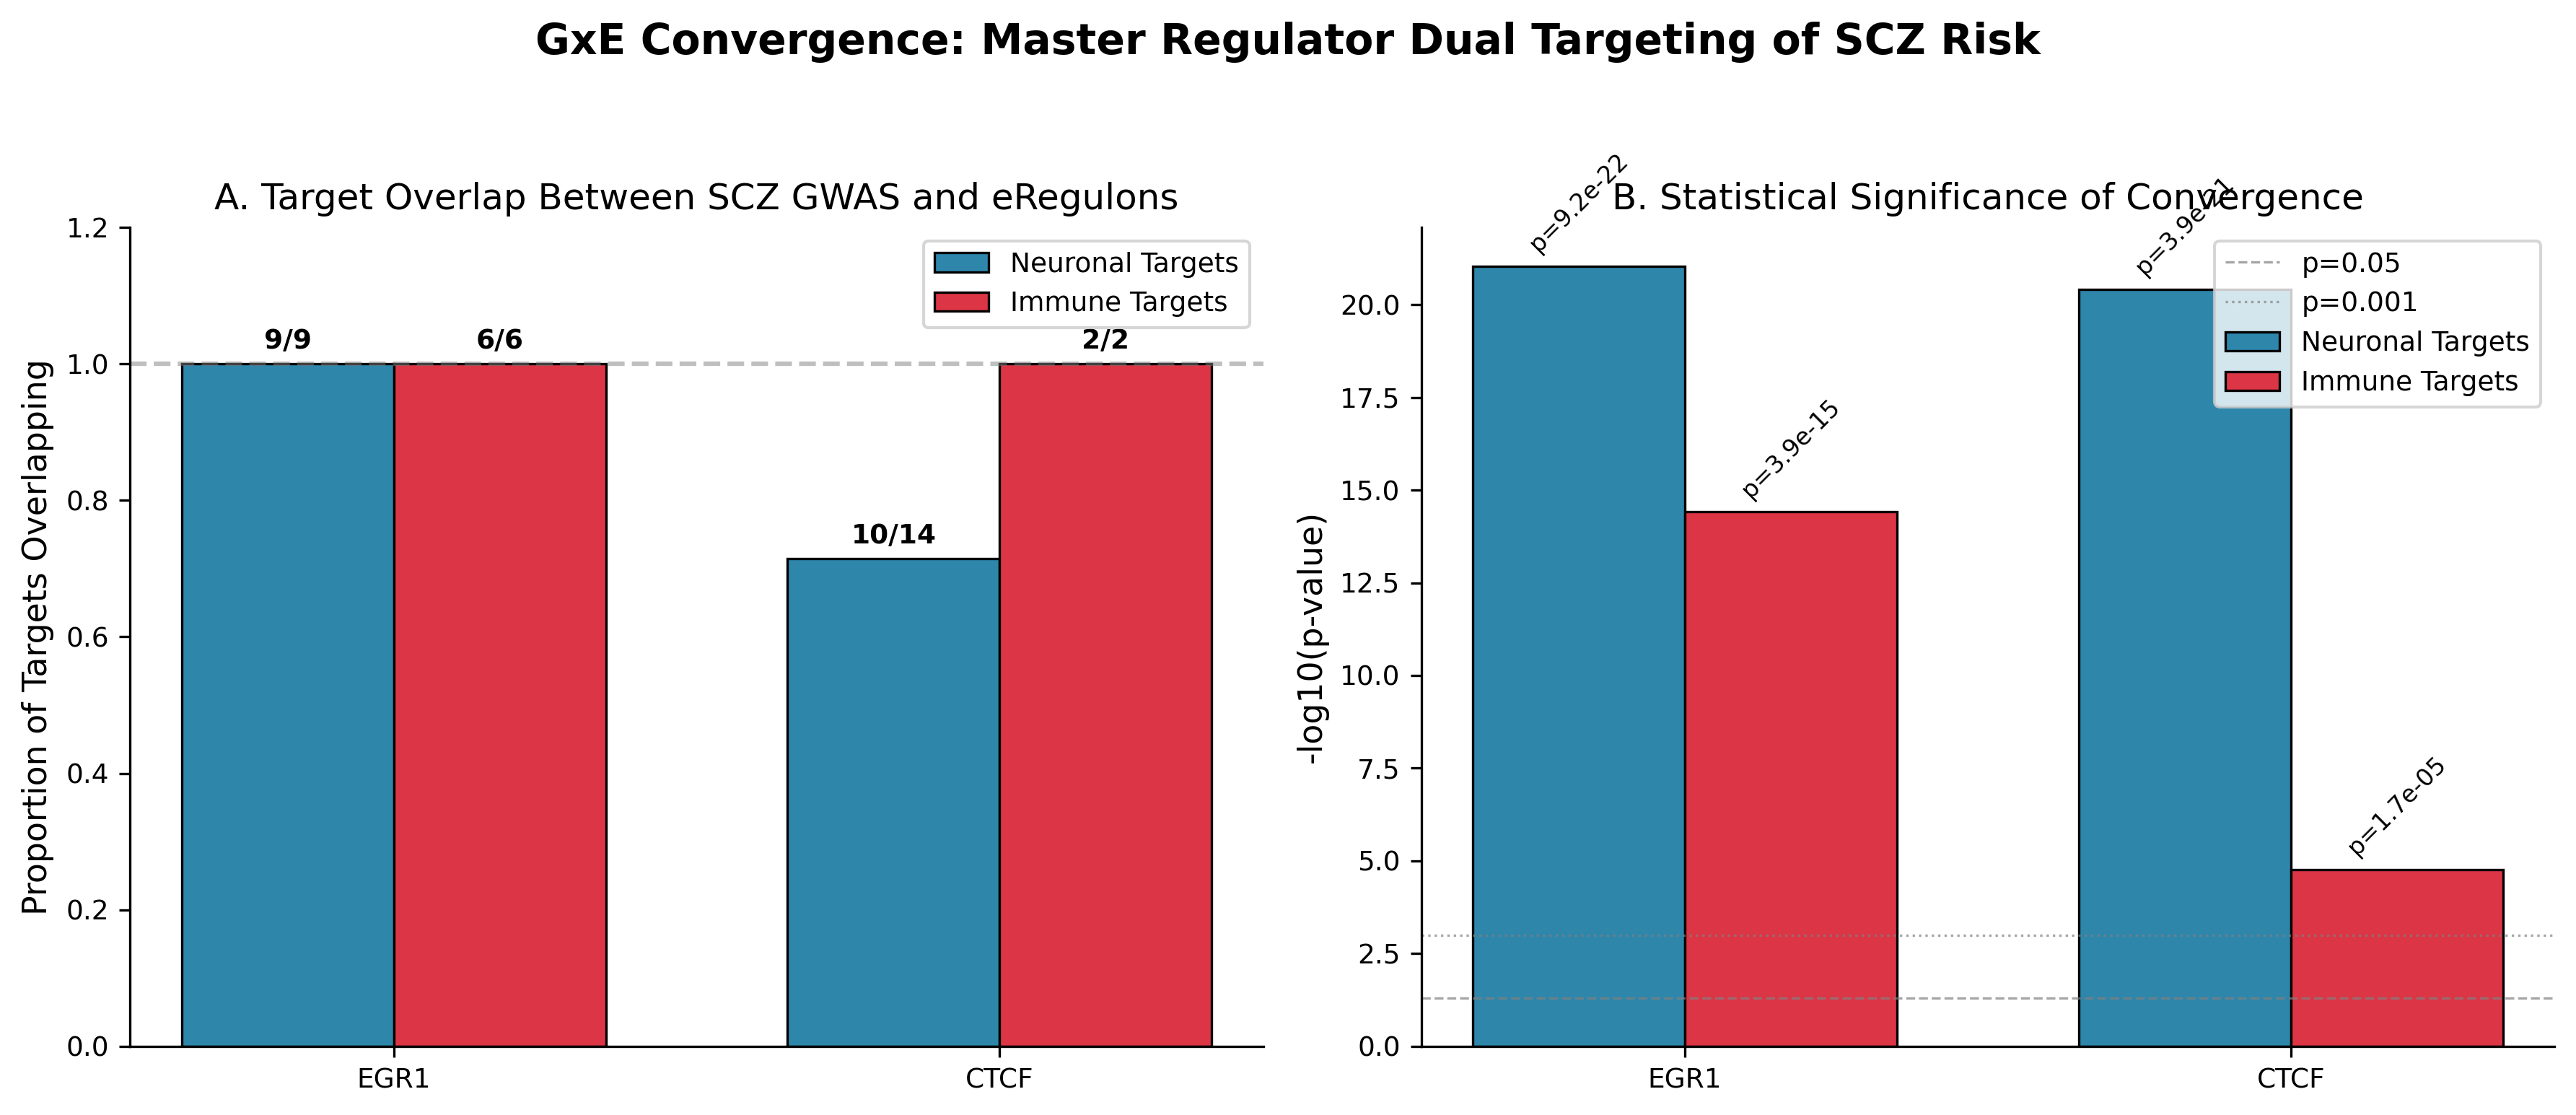 DoRothEA-based regulon overlap showing EGR1 and CTCF enrichment across SCZ neuronal and immune gene compartments. This figure shows one of two computational frameworks; the quantitative claim in this study rests on convergence with independent PWM motif enrichment AND cross-disorder comparators showing EGR1/MEF2C enrichment is shared across SCZ, ASD, and DDD, while CTCF is possibly SCZ-preferential.
Confidence: Strong for enrichment at SCZ gene promoters. Moderate for SCZ-specificity — EGR1/MEF2C are pan-NDD; CTCF is possibly SCZ-preferential pending replication. The ChIP-seq gap motivates activity-dependent binding experiments.
Constraint architecture
Analysis of evolutionary constraint using gnomAD v4.1 (cross-version concordance with v2.1.1: pLI ρ=0.833, LOEUF ρ=0.843) revealed a critical sub-structure within the common-variant gene set. The full set of PGC3 MAGMA-significant protein-coding genes (EDT1, n=261 with gnomAD entries) showed no significant enrichment for loss-of-function intolerance: pLI OR=1.14 (p=0.41), LOEUF OR=0.86 (p=0.24), missense Z OR=0.95 (p=0.81). This is the most important negative result in the project: the broad common-variant gene set is not uniformly constrained. (This gene-level null is not inconsistent with Pardiñas et al. 2018’s report that SCZ heritability is enriched in mutation-intolerant genes via S-LDSC — that was a SNP-level test across all polygenic signal including subthreshold variants, while our test captures only the genome-wide-significant tail.)
The 14-gene B3 hand-curated canonical-synapse list (DLGAP1, GRIN2A, NRXN1, CNTNAP2, ARC, DLG4, NRXN2, NLGN1, NLGN2, SHANK1, SHANK3, HOMER1, SYN1, GAP43 — curated from SynGO annotations and the SCZ genetic literature) showed extreme constraint: pLI OR=26.44 (p=2.22×10⁻⁷, BH q=2.67×10⁻⁶).
Critically, this constraint decomposes into two stacking components. Synaptic genes as a class are broadly constrained: SynGO-annotated genes not associated with SCZ (n=1,478 with gnomAD data) show pLI OR=4.45 (p=1.2×10⁻¹³⁹), with 44.2% in the most-constrained pLI bin versus 15.1% genome-wide. Within that already-constrained class, SCZ-associated synaptic genes show additional concentration at the high-constraint end: within-class OR=6.94 (95% CI [1.53, 31.42], p=0.004), with 84.6% vs 44.2% in the pLI≥0.9 bin. The total effect against the genome (~4.5 × 6.9 ≈ 31, consistent with the observed OR=26.44) is a product of class membership and SCZ-specific within-class concentration.
SCHEMA exome-wide significant genes (n=9 with gnomAD entries) were categorically constrained: all nine had pLI>0.9 (Haldane-corrected OR=89.7; LOEUF≤0.35 OR=95.95, confirming the signature is not a pLI-saturation artifact).
Functional decomposition of the EDT1 set (tiers are not mutually exclusive):
| Functional tier | n | pLI OR | Interpretation |
|---|---|---|---|
| Synaptic (SynGO) | 11 | 20.91 | Strongest tier |
| Glutamate receptor | 3 | 32.5 [1.7–629], Haldane-corrected | All 3 pLI>0.9 |
| Transcriptional regulator | 4 | 13.91 | Significant |
| Ion channel | 6 | 0.93 | No constraint |
| Mitochondrial | 8 | 1.54 | No constraint |
The constraint hierarchy connects rare and common variant architecture through a single biological axis: synaptic function at the postsynaptic density. SCZ risk genes do not show significant enrichment near Human Accelerated Regions (B3 OR=1.73, p=0.46; EDT1 OR=1.34, p=0.16), consistent with concentration at the most phylogenetically conserved synaptic genes, not at rapidly-evolving human-specific regulatory elements.
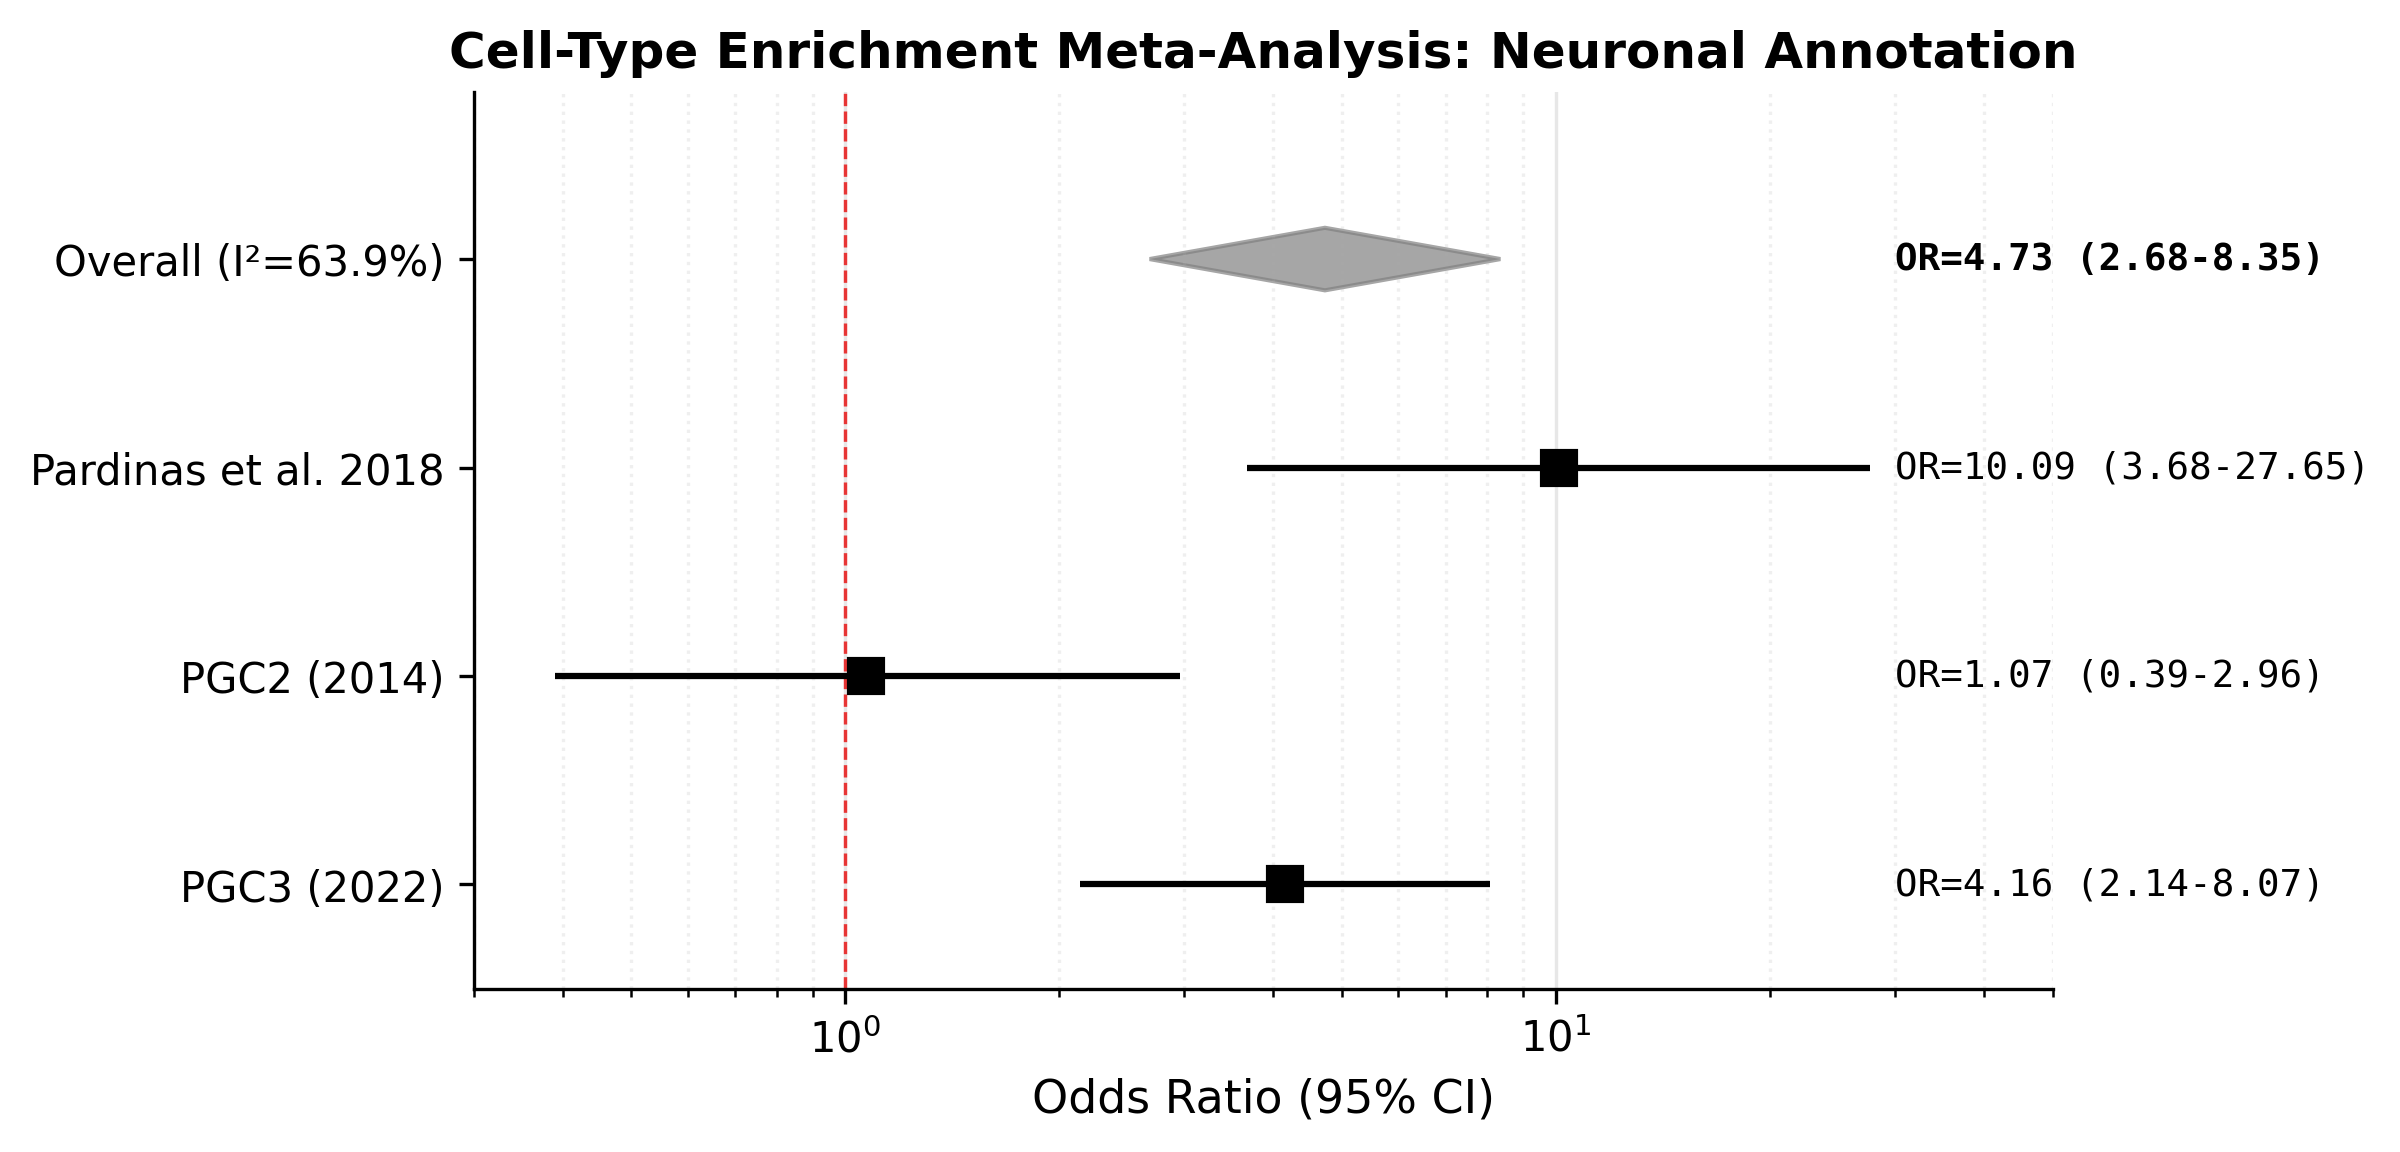 S-LDSC partitioned heritability (neuronal 1.83-fold, p=0.009) and cross-GWAS meta-enrichment across Pardiñas, PGC2, and PGC3. The core neuronal claim rests on the individual methods, not the heterogeneous meta-analysis (Hartung-Knapp p=0.154).
Confidence: Strong. The two-layer decomposition (class effect OR=4.45 + within-class SCZ concentration OR=6.94) survived gene-length-stratified permutation, orthogonal LOEUF cross-check, and functional-tier decomposition. An independent arithmetic SynGO construct (ST12, n=56, only 2/14 overlap with B3) also shows significant constraint (pLI OR=9.35), confirming the finding is not driven by the hand-curated gene selection.
Cross-disorder
Cross-disorder S-LDSC showed neuronal annotations were directionally positive for MDD (1.66-fold, p=0.095) and ASD (2.24-fold, p=0.080), with overlapping uncertainty intervals and weaker power. Genetic-correlation profiling confirmed shared psychiatric architecture: SCZ-MDD r_g=0.390, SCZ-ASD r_g=0.245, SCZ-anxiety r_g=0.312, SCZ-cognitive performance r_g=-0.238. CRP correlation was null (r_g=-0.020, p=0.646), reinforcing the conclusion that the project does not support a systemic-inflammatory interpretation.
Constraint-based gene-set analysis applied to the B3 high-confidence SCZ-postsynaptic gene set identified a pan-psychiatric pattern: SCZ (β=+3.24, q=1.2×10⁻¹⁸), MDD (β=+1.09, q=4×10⁻⁴), and ASD (β=+1.11, q=3×10⁻⁵) are each independently significant and directionally concordant. BIP (β=+0.07) and ADHD fail to reach significance despite substantial GWAS power. IBD, height, and AD show null or marginal signals, confirming diagnostic specificity.
Under gnomAD gene-length-matched permutation, ASD (OR=25.4) and dominant developmental disorders (OR=31.3) show constraint enrichments of the same magnitude class as SCZ, with no Holm-significant pairwise difference (Fisher 2×2 all p=1.0; Wilcoxon on continuous pLI all p≥0.18). The constraint axis is shared across severe neurodevelopmental conditions. Cross-disorder convergence on constraint may also partially reflect shared exome-discovery ascertainment (discovery bias in the sense of Cassa et al.). SCZ-distinctive features reside at the within-class constraint concentration (OR=6.94), possibly at CTCF motif enrichment, and at the cortical cell-type S-LDSC level where only SCZ reaches significance among tested disorders.
Confidence: Moderate for the cross-disorder constraint sharing. The equivalence rests on non-significance of pairwise tests (absence of evidence, not evidence of absence) and the discovery-bias confound remains untested.
Tractability
SCZ genes formed a denser protein-protein interaction network than degree-matched random expectation (1.50-fold enrichment, empirical p=0.001), but the realistic effect size is modest (materially smaller than the highly inflated native STRING significance estimate).
Drug-target overlap was tested across four backgrounds using DGIdb-annotated approved-drug interactions:
| Background | OR | p-value | Interpretation |
|---|---|---|---|
| All protein-coding | 2.33 | 3×10⁻⁹ | Enriched vs genome |
| Brain-expressed | 2.08 | 9.5×10⁻⁶ | Enriched vs brain genes |
| Druggable universe | 1.03 | 0.93 | Null vs characterized targets |
| Expression+length matched | 2.09 | 1.8×10⁻⁷ | Enriched vs matched genes |
The result is database-definition-dependent: SCZ genes are enriched for drug targets relative to the genome but not relative to the subset of genes that have been characterized for drug interactions. The appropriate background depends on the translational question. For drug-repurposing screens, the genome-wide enrichment is relevant; for assessing whether SCZ genes are preferentially druggable among characterized targets, the null against the druggable universe is the relevant comparator.
Regardless of drug-target overlap statistics, the constraint architecture suggests that highly constrained synaptic proteins are biologically difficult to perturb directly. The regulatory layer — EGR1-mediated activity-dependent transcription (shared across NDD conditions) and CTCF-mediated chromatin architecture (possibly SCZ-preferential) — may represent the more tractable therapeutic axis. Because EGR1 enrichment is shared across SCZ, ASD, and DDD, modulation of EGR1-dependent transcription (e.g., via MEK/ERK pathway) would target the same constrained synaptic substrate across diagnostic categories.
PoPS gene-level ranking confirmed that the neuronal synaptic module (M1, n=47 genes) achieves genuine GWAS enrichment (MAGMA-Z Fisher OR=3.40, p=0.005), validated by a circularity audit showing that 9 of the overlap genes (CACNA1C, DLG1, DLGAP2, GRIN2A, MAPK3, NRXN1, PCLO, RIMS1, SYNGAP1) form a coherent synaptic set identified purely from GWAS proximity signal. A myelination module (M3, n=29) passed PoPS enrichment (OR=3.97) but failed the circularity check (MAGMA-Z OR=1.32, p=0.46, only 2 overlap genes), indicating PoPS training-feature amplification rather than genuine GWAS convergence.
Gaussian mixture modeling (MiXeR, 20 replicates, all converged) estimates ~32,000 causal variants contributing to SCZ risk (nc=32,186 ± 414, CV=2.8%), concordant with prior PGC2 estimates. The model-implied heritability (h²=0.823) exceeds the LDSC estimate (~0.24 liability-scale), a well-documented discrepancy reflecting different modeling conventions.
Attempts to identify reproducible mechanistic subtypes failed: k-means clustering (k=2-5) on 8-disorder MAGMA-Z profiles yielded split-half ARI=0.39-0.44, all with permutation p>0.24. Spectral clustering was fully degenerate. PCA variance was near-isotropic (PC1 explains 17.9% vs 12.5% expected). The data support a view of SCZ genetic architecture as a single heterogeneous risk pool with identifiable functional concentrations (synaptic scaffold, neuronal regulation) rather than discrete mechanistic subtypes resolvable from current GWAS summary statistics.
Confidence: Moderate for the regulatory-targeting direction. Drug-target overlap is the empirical observation (definition-dependent); the regulatory-targeting alternative is a hypothesis from the convergence architecture, not a tested therapeutic strategy.
Sources, datasets, and literature
Datasets
- PGC3 European-ancestry SCZ GWAS (Trubetskoy et al. 2022, figshare DOI 10.6084/m9.figshare.19426775) — 76,755 cases, 243,649 controls. Primary summary statistics for S-LDSC and MAGMA.
- PGC2 SCZ GWAS (Schizophrenia Working Group 2014) — 36,989 cases, 113,075 controls. Used for meta-analysis sensitivity testing.
- Pardiñas et al. 2018 prioritized gene set (Nature Genetics) — Common-variant gene set, primary input for Fisher enrichment and constraint analysis.
- PanglaoDB (panglaodb.se) — Single-cell cell-type marker sets, baseline cell-type framework.
- DoRothEA/OmniPath — Transcription-factor regulon target sets for regulon-based enrichment.
- JASPAR 2022 (jaspar.genereg.net) — Position-weight matrices for motif enrichment.
- gnomAD v4.1 (gnomad.broadinstitute.org) — pLI, LOEUF, missense Z, synonymous Z constraint metrics. Cross-version concordance with v2.1.1: pLI ρ=0.833, LOEUF ρ=0.843.
- SCHEMA (schema.broadinstitute.org) — Rare coding variant gene-level statistics for schizophrenia.
- SynGO (syngoportal.org) — Curated synaptic gene annotations (Koopmans et al. 2019).
- BrainSpan (brainspan.org) — Allen Brain Atlas developmental expression.
- S-LDSC — Baseline-LD v2.2 annotations, Alkes Price group LDSC resources (Zenodo record 7768714).
- ENCODE — ChIP-seq peak data for EGR1 and CTCF at SCZ gene promoters.
- DGIdb (dgidb.org) — Drug-gene interaction database for drug-target overlap analysis (strict: DrugBank, GtoPdb, ChEMBL, TTD).
Software
S-LDSC (Python), MAGMA (gene-level analysis), PoPS (ridge regression gene prioritization), MiXeR (Gaussian causal mixture modeling), Fisher’s exact test / permutation testing (Python/SciPy).
Selected literature
- Trubetskoy et al. 2022. PGC3 SCZ GWAS. Nature 604:502-508.
- Pardiñas et al. 2018. Common SCZ alleles enriched in mutation-intolerant genes. Nature Genetics 50:381-389.
- Singh et al. 2022 (SCHEMA). Rare coding variants in 10 genes. Nature 604:509-516.
- Skene et al. 2018. Genetic identification of brain cell types underlying SCZ. Nature Genetics 50:825-833.
- Sekar et al. 2016. SCZ risk from complex variation of complement component 4. Nature 530:177-183.
- Koopmans et al. 2019. SynGO: an evidence-based synapse knowledge base. Neuron 103:217-234.
- Weeks et al. 2023. PoPS: polygenic enrichment of gene features. Nature Genetics 55:1267-1276.
- Satterstrom et al. 2020. Large-scale exome sequencing study implicates both developmental and functional changes in the neurobiology of autism. Cell 180:568-584.
- Kaplanis et al. 2020. Evidence for 28 genetic disorders discovered by combining healthcare and research data. Nature 586:757-762.
- Simonsohn et al. 2020. Specification curve analysis. Nature Human Behaviour 4:1208-1214.
Full corpus, including rejected sources and per-analysis artifact lists, in the project repository.